| Discrete Dynamics Lab |
Update November 2018ddlabz07 is documented in an updated hyperref PDF ExploringDiscreteDynamics-updateJan2018.pdf which can be downloaded HERE. This is an updated version of Exploring Discrete Dynamics, Second Edition (EDD2) (2016) published by Luniver Press, a 8x10 inch 577 page paperback with color figures, which can be purchased at Amazon-UK, Amazon-USA, and other online book sellers.
November 2018 updates (on the
Jan 2018 release)
include new options for investigating "Pulsing dynamics in randomly wired glider cellular automata"
(preprint)
in 2D 3-value totalistic CA, though the options apply in general.
As well minor improvements and bug fixes, updates include: |
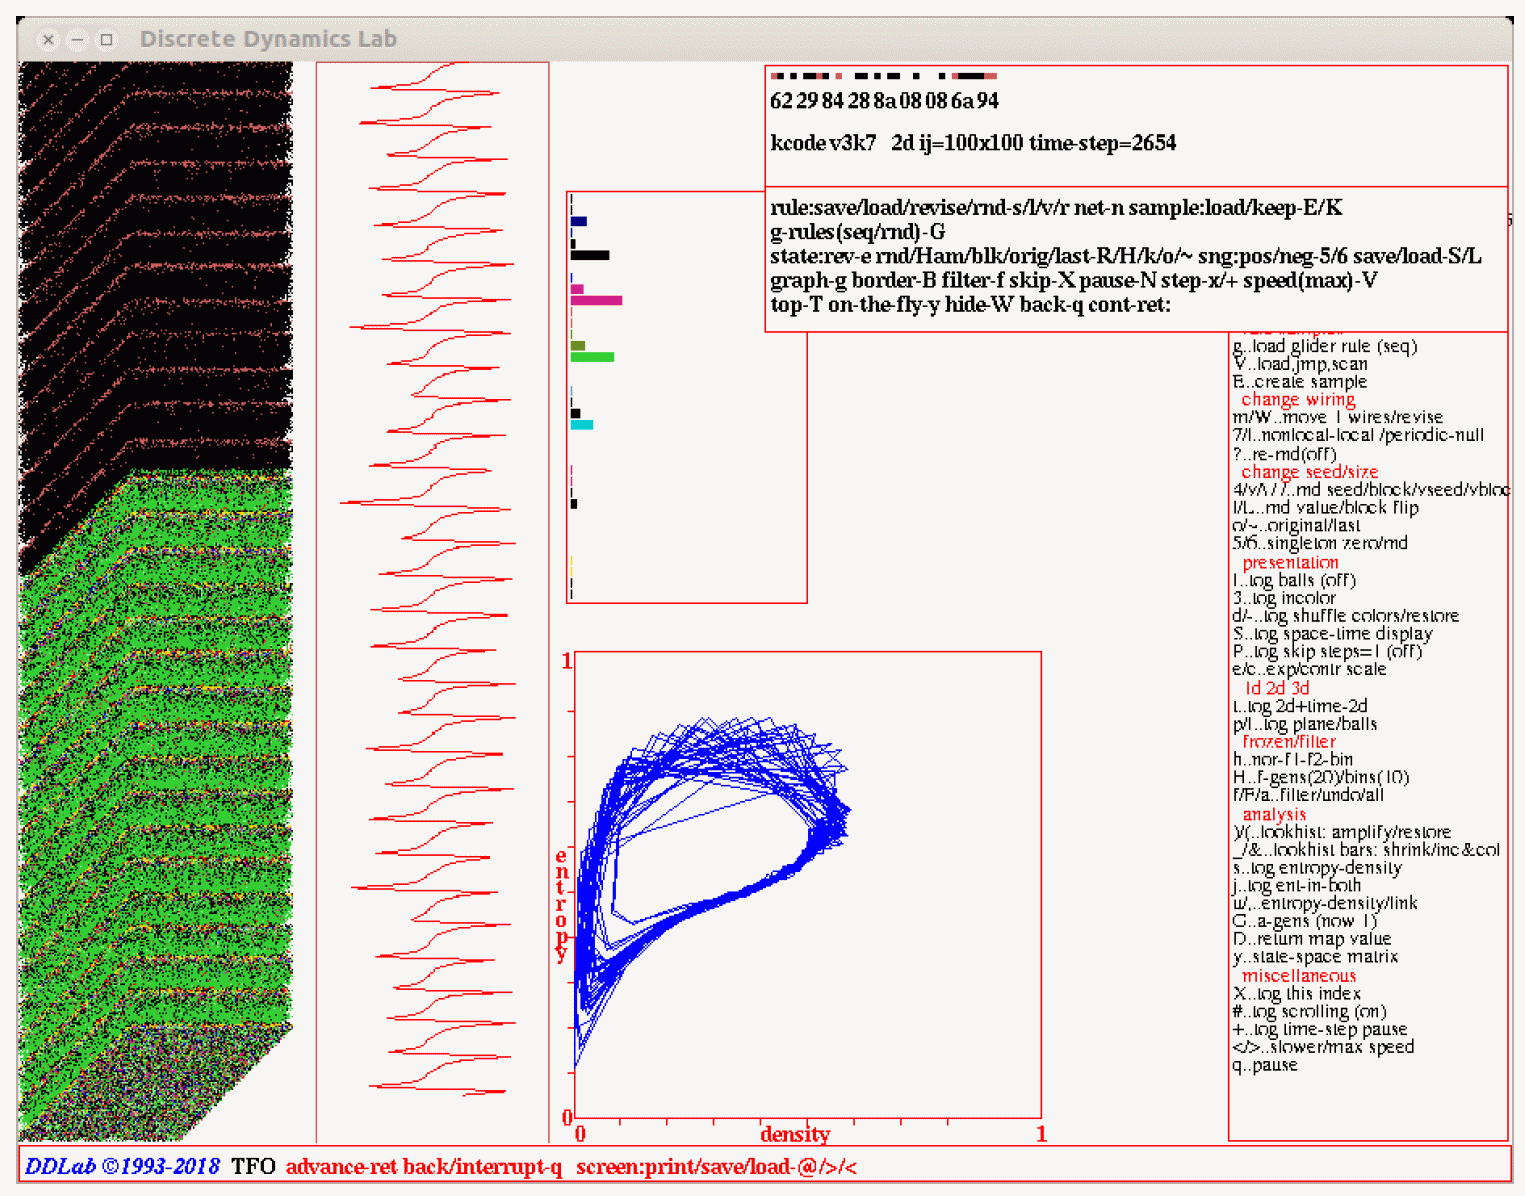
The DDLab screen showing pulsing dynamics. 2D space-time patterns, 100x100, scroll vertically upwards on the left. The present time-step is at the bottom. The dark time-steps at the top are colored by value, and below by neighborhood colors. To the right of space-time patterns is the entropy plot and the input-histogram, below center the entropy-density plot with linked dots. Interrupt prompts are shown top-right, and on-the-fly reminder on the right. The rule is v3k7 g3 (hex) 622984288a08086a94. |
xxxxxxxxxxxxxxxxxxxxxxxxxxxxxxxxxx DDLab has been updated at regular intervals since its release in 1995. Its precursor was the Atlas software included on diskette inside the back cover of "The Global Dynamics of Cellular Automata" 1992. For a list and download of this and older versions click here.
(EDD2ndEd-update) is the latest documentation
Jan 2018
(EDD2ndEd-update) |
EDD#32.7.3 While running space-time patterns,
a new on-the-fly key-hit ? (question mark) allows nonlocal (random) wiring to be
re-randomised at each time-step.
The network will be re-randomised according to any random
wiring biases originally set in EDD#11 and EDD#12. It turns out that re-randomising makes no difference to the
characteristic pulsing waveform.
New complex "glider" rule collections are included in the updated dd_extra.tar.gz file.
Activate a "glider" rule with on-th-fly with keyhit g. The collections include these
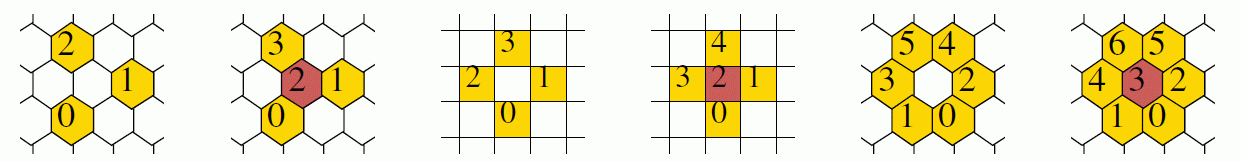
2d neigborhoods for k=3 to 7.
On the left, typical data output is shown where the wave length is automatically
recognised, despite a jagged plot profile and irregular wavelength.
To save the data, interrupt with q,then enter d
for as described in EDD#32.12.6.2.
Cell values: 0=white, 1=red, 2=black.
Green trails of 5 time-steps indicate glider velocity.
EDD#32.12.1 While the "entropy-density plot" or the "density return map" is active,
on-the-fly key-hit , (the coma) will toggle the connection of successive dots
of the scatter plot for a linked history, as in the examples above for the
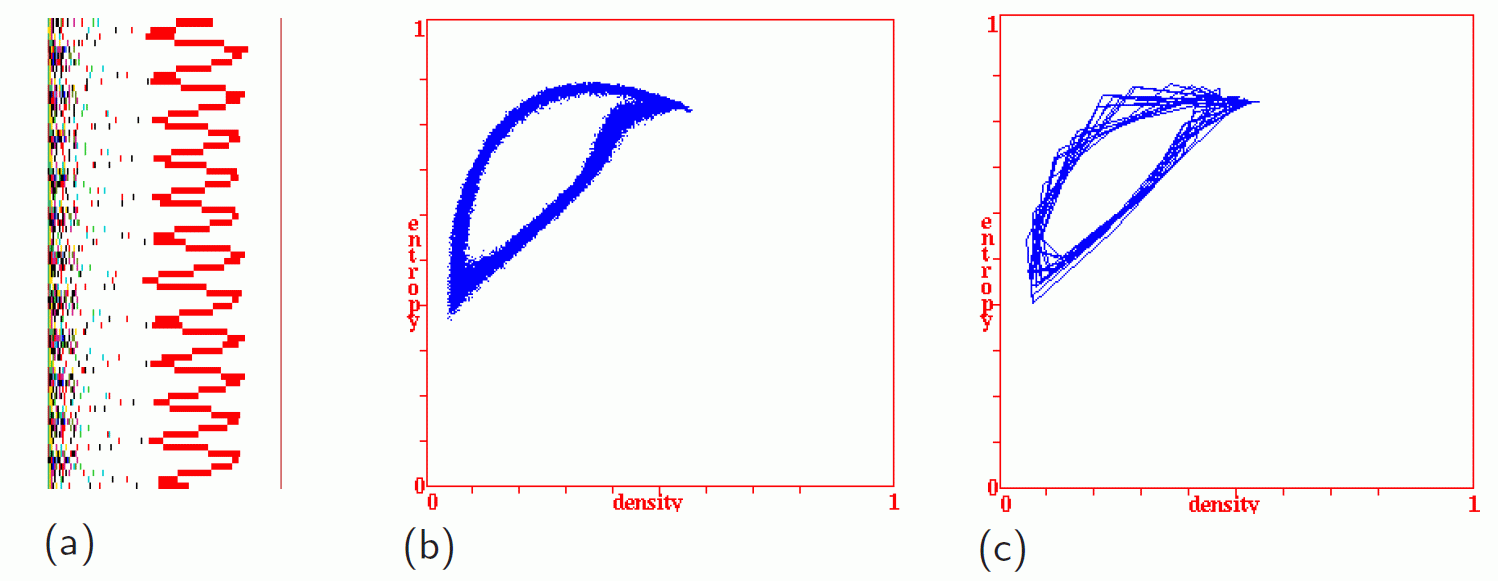
(a) Input-entropy oscillations with time, wavelength=7 time-steps,
Left edge: superimposed histogram values plots.
(b) The entropy-density scatter plot --- input-entropy (y-axis)
against the non-zero density (x-axis), for about 33000 time-steps.
(c) The same plot for just a few pulsing cycles, but linking successive dots giving a time-history.
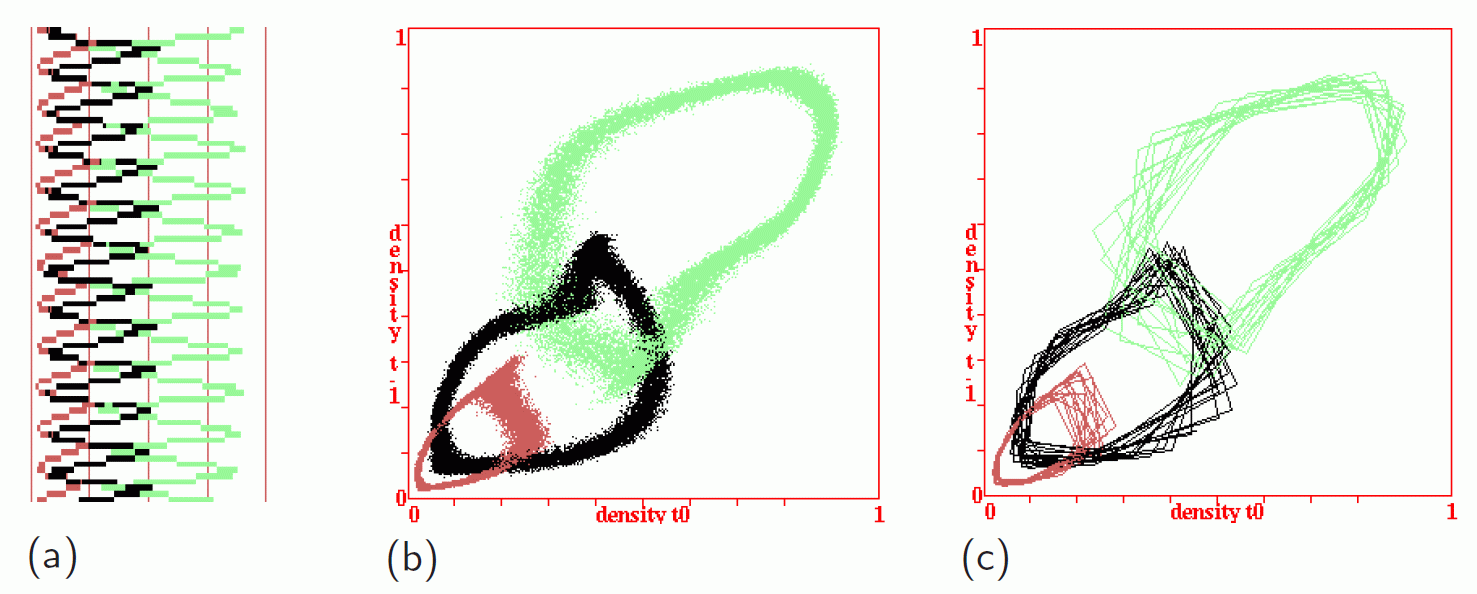
(a) Value-density oscillations with time. 0=green, 1=brown, 2=black.
(b) The density return-map scatter plot --- the density of each value at t (x-axis)
against its density at t+1, plotted as colored dots,
for about 33000 time-steps.
(c) The same plot for just a few pulsing cycles, but linking successive dots giving a time-history.
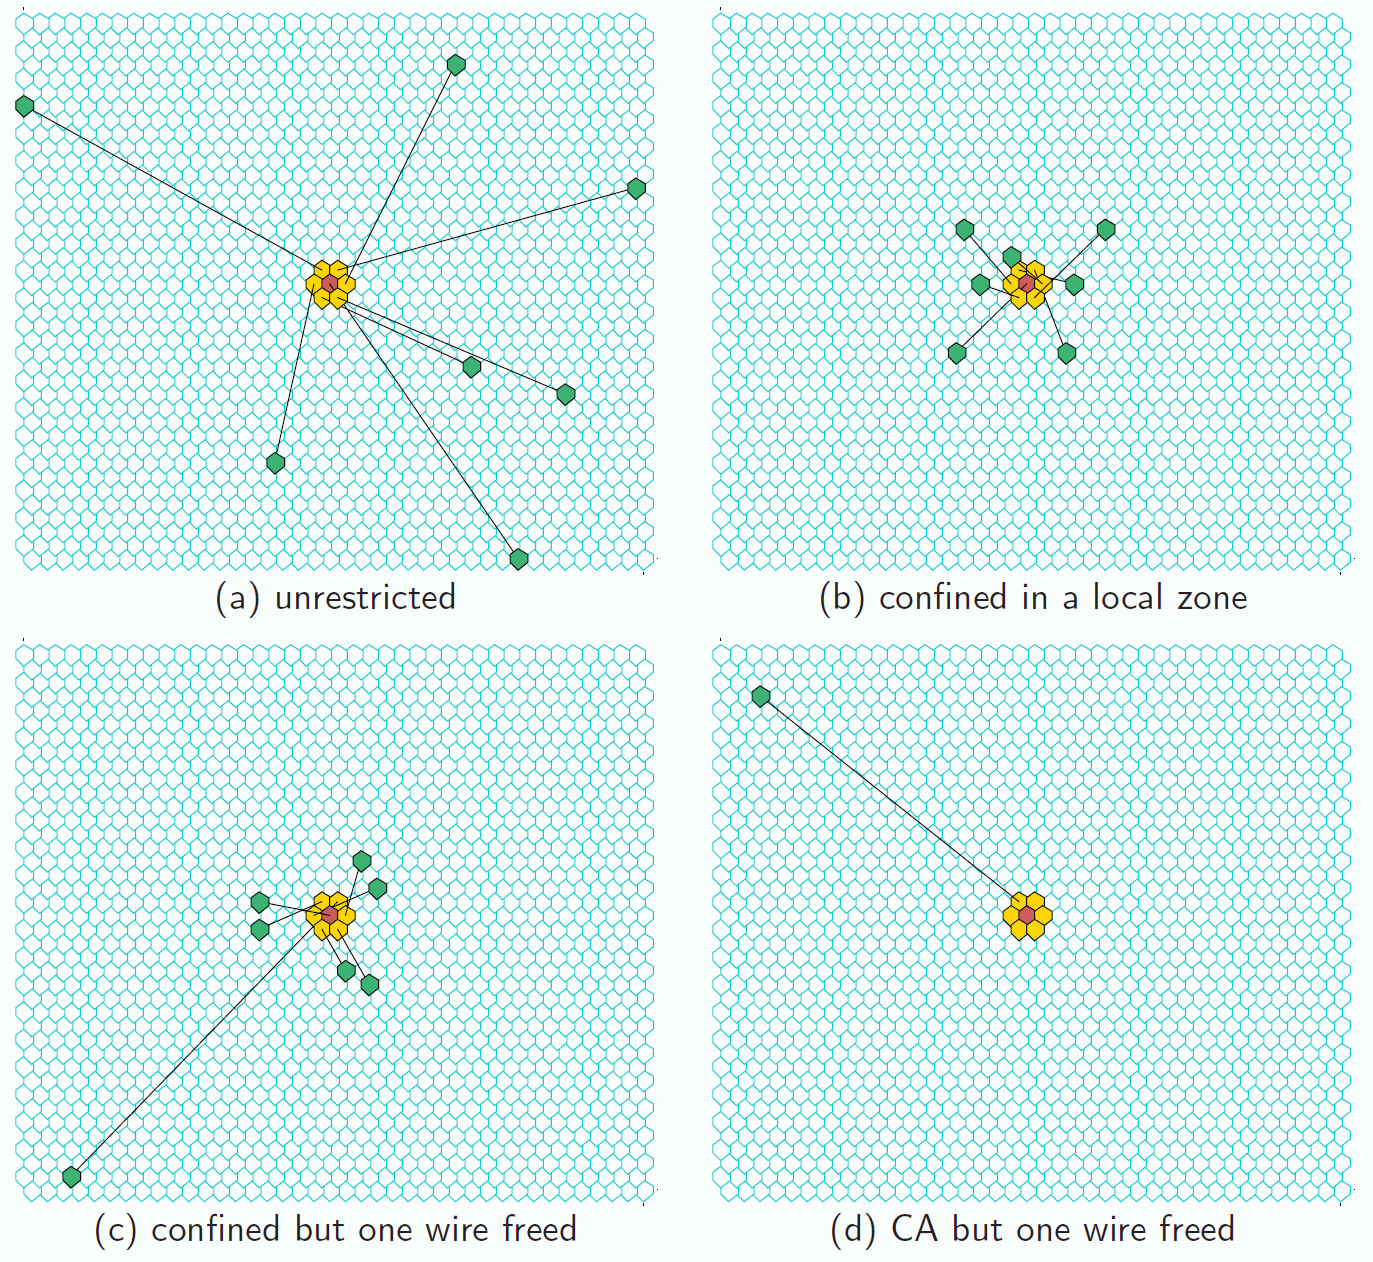
Examples of random wiring in a 40x40 2D lattice. A bigger lattice would
normally be required for robust pulsing, to avoid reaching a uniform value attractor.
The cellular automaton pulsing model
(preprint)
described the surprising phenomenon of spontaneous, sustained and
robust rhythmic oscillations, pulsing dynamics, when random wiring
is applied to a 2D ``glider'' rule running in a 3-value totalistic CA.
The characteristic wave-forms are robust and depend
on the specific glider rule applied.
Return to the
Discrete Dynamics Lab home page.
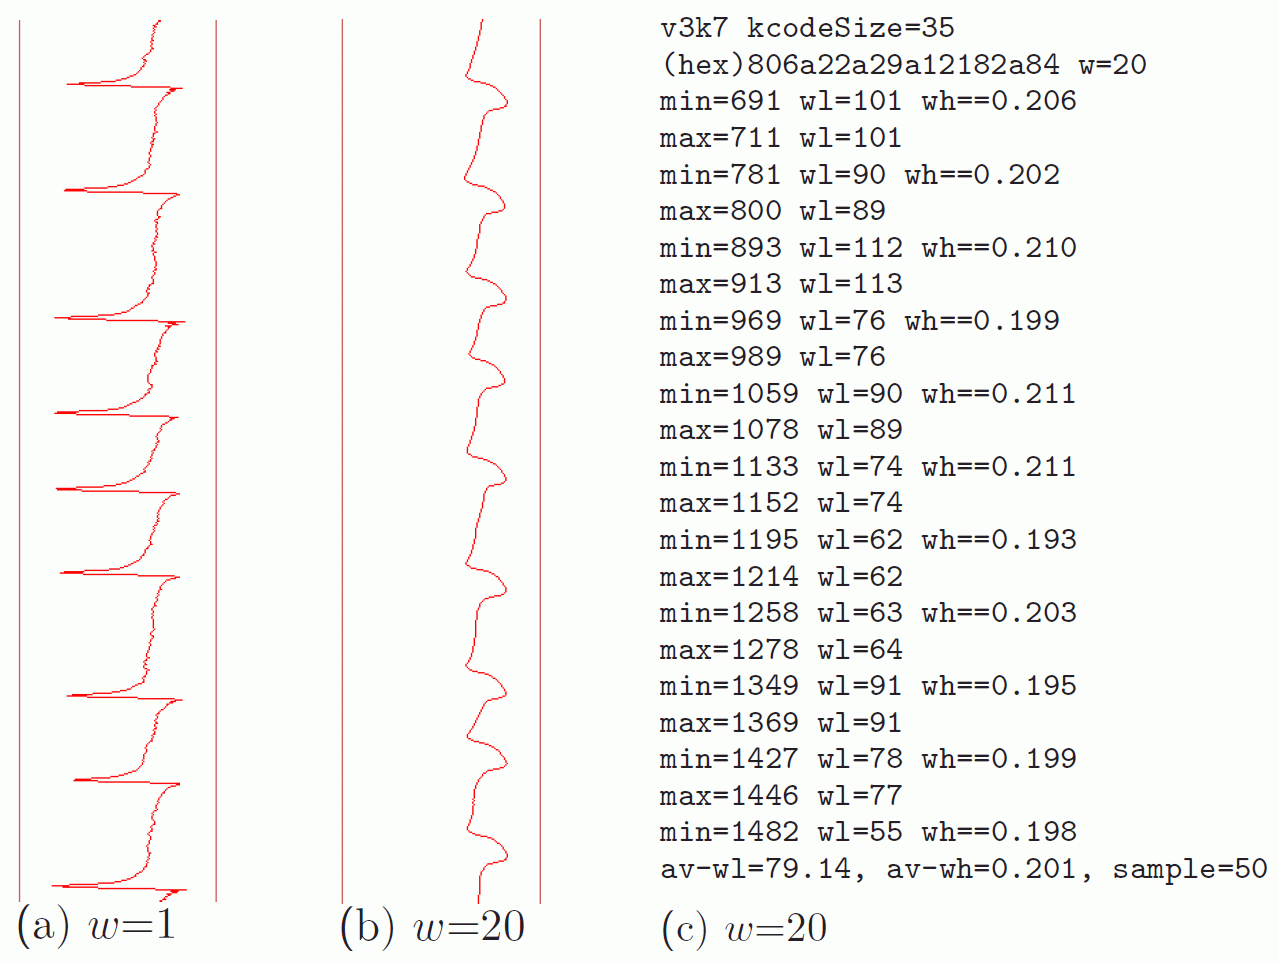
Wave-length EDD#32.12.6.2 If pulsing is present and the "entropy-density plot" is active,
a new on-the-fly key-hit " (inverted coma) will
toggle automatic data in the terminal to identify the pulsing wavelenght and waveheight.
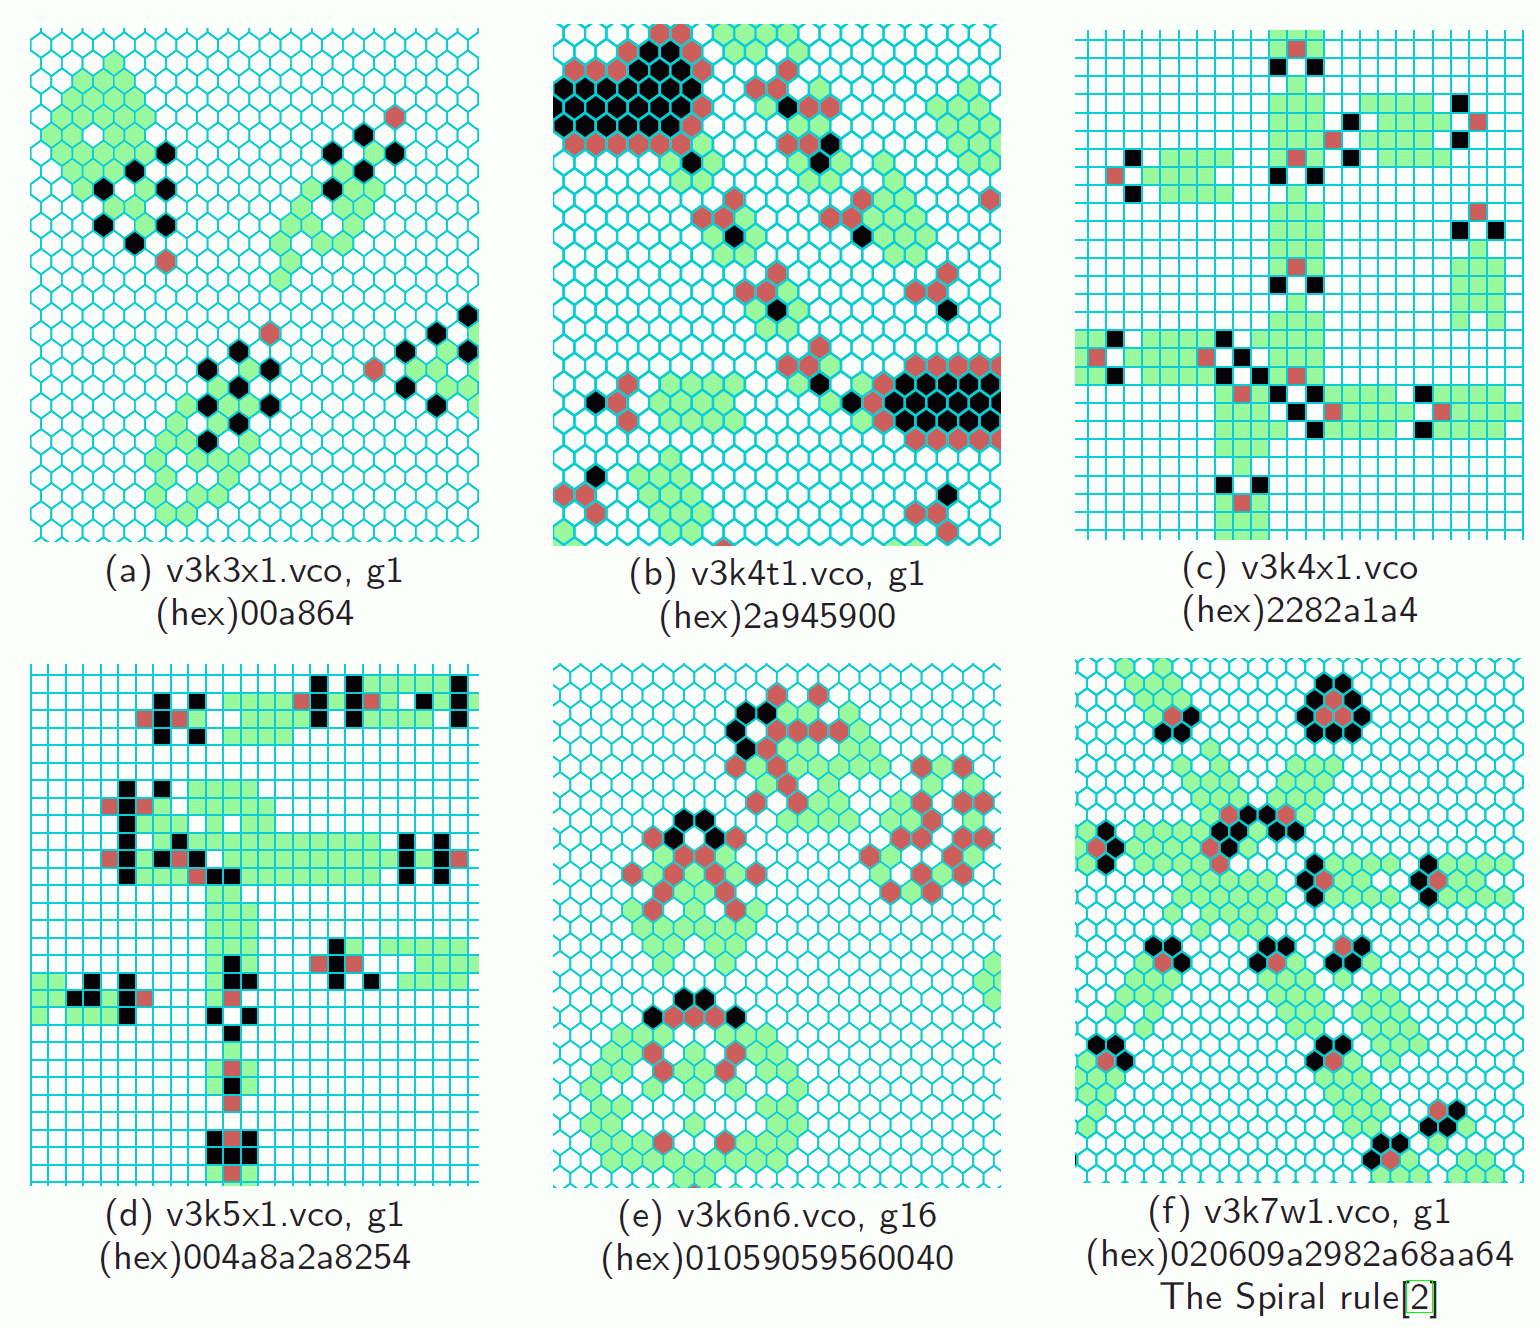
Examples of the 2d space-time patterns of
v=3 glider rules that pulse when the local CA
wiring is randomised. These are from the "glider" rule collections,
where g
Last modified: Nov 2018